


As the 14th Annual Activated Insights Benchmarking Report triples in size, we’re bringing you a holistic view into the future of the care continuum. Benchmark your performance against the industry with compelling new data points across home care, home health, and hospice.
We’re seeing a significant shift in the state of the post-acute care industry.
As employee satisfaction rates drop, training strategies are tested, and customer growth rates expand, the Activated Insights Benchmarking Report is forecasting the patterns, trends, opportunities, and threats facing the industry in 2023.
Make data-driven business decisions with these top findings on sales and marketing, recruitment and retention, training, finance, operations, and customer and employee experience.
Sales & Marketing—Finding #1: It pays to create a buzz-worthy reputation in the post-acute care industry.
Successful post-acute care marketing looks like creating a lasting employee and customer experience that speaks for itself—and lets your reputation do the advertising.
As the top marketing source with the lowest turnover rate for home care, home health, and hospice, past and current customer referrals generate over one third of all revenue.
It also pays to pay attention. In the past year, providers who tracked every inquiry about their services saw a higher median revenue by over $1,215,759 compared to those who didn’t track all inquiries.
Likewise, Care Intelligence Platform users saw a 57% increase in annual inquiries, which may be why Activated Insights users thrived during the pandemic compared to the rest of the industry.
Create a buzz-worthy reputation by being one of the 26.8% of providers prioritizing strengthening their relationships with referral sources in 2023.
Recruitment & Retention—Finding #2: Providers are losing customers, and employees to quick wins—retention is an investment.
In the post-acute care industry, R&R doesn’t stand for rest and relaxation; instead, providers are finding themselves caught in the revolving doors of recruitment and retention.
Three quarters of all providers had to turn down cases due to the care professional shortage. This is likely due to high turnover, which spiked 12% in the last year after staying steady for the last 3 years, reaching a staggering 77.1% annual turnover rate.
The median home care customer growth rate jumped back to pre-pandemic numbers after a sudden dip and sharp rise in the last two years.
This is likely related to recruitment sources and the reason 40% of all providers are prioritizing recruitment and retention programs. Although Indeed continues to be the most popular recruitment source, it produces the highest turnover rate, much like similar online recruitment platforms.
To resolve this recruitment and retention black hole, it’s worth investing in compensation packages and recruitment sources that produce long-term satisfied employees that pay off in the long run. This is likely why providers paying above the 75th percentile saw a 12.6% decrease in turnover; although employee referrals have the highest acquisition cost, they produce the lowest turnover rate.


Training—Finding #3: Professional training programs produce the highest ROI and cost the least in the long run.
After lack of adequate training made it to the #2 complaint from employees in the last year, providers are ramping up their training efforts—and those who are doing it strategically are seeing the highest Return on Investment.
Offering 5 additional hours of training in home care, or 8 hours more for home health and hospice, was the difference between being extremely impacted by staff shortages or not at all.
74.2% of providers now use a professional training program to generate the highest revenue and lowest overall turnover rate.
This makes sense when you look at acquisition cost to median revenue per care professional. While in-house training cost the least in acquisition, it also produced the lowest revenue per employee at $13,835.
See an increase of $681,672 in revenue by offering at least 8 orientation hours and 12 hours of ongoing training.


Finance—Finding #4: The success of the industry lies in the ability to retain hourly care employees, but turnover is the worst it’s been in 5 years.
Rumors of an expanding industry customer base prove true as historical median revenue rose by $52,192 in the last year, the highest annual increase in the last 4 years.
However, a sharp decrease in 2023’s weekly billable hours for both live-in and hourly care may be cause for concern as rates are the lowest they’ve been in 5 years. As hourly care remains the top service offering, producing 85.9% of all revenue, it will be imperative for providers to recruit and retain hourly care staff to keep up with the demand.
In an effort to bridge the gap, providers are diversifying their top 5 payer sources: private pay, long-term insurance, Medicaid Waiver program, Veteran Administration programs, and direct Medicaid billing.

Operations—Finding #5: Customer turnover rate has been declining for the last 5 years, but less than a third of providers are capitalizing on that success.
In the last year alone, customer turnover dropped by 5%, resulting in an average 50.2% turnover rate—the lowest it’s been in 5 years. This post-acute care win means that more customers than ever are enjoying your services enough to stay long-term.
However, only 26.5% of providers are taking advantage of reputation management software to solicit and collect these positive reviews.
There’s more that providers need to track to improve revenue, including crucial KPIs like hospital readmission rates—a metric less than one third of providers are currently tracking.

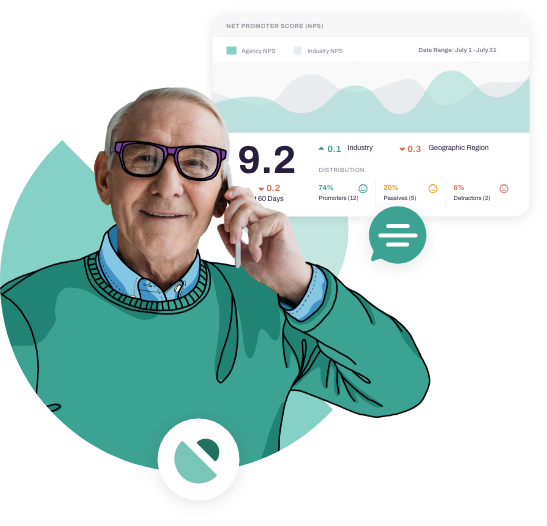
Customer & Employee Experience—Finding #6: Providers who gather and act on employee and customer feedback retain customers 20% longer.
The good news is that the average Overall Care Professional Satisfaction Score received a 9.1, which means your employees are satisfied.
The bad news is that they aren’t satisfied enough to recommend their friends to come join them as eNPS dropped to 6.7.
Which proves that gathering and acting on their feedback matters.
Organizations that use Activated Insights retained customers 20% longer, likely contributing to the average Net Promoter Score and Overall Customer Satisfaction Score increasing this year.
Gather and act on your employee and customer feedback to become the company that employees recommend to their friends and customers recommend to their loved ones.

Next steps:


Related Posts