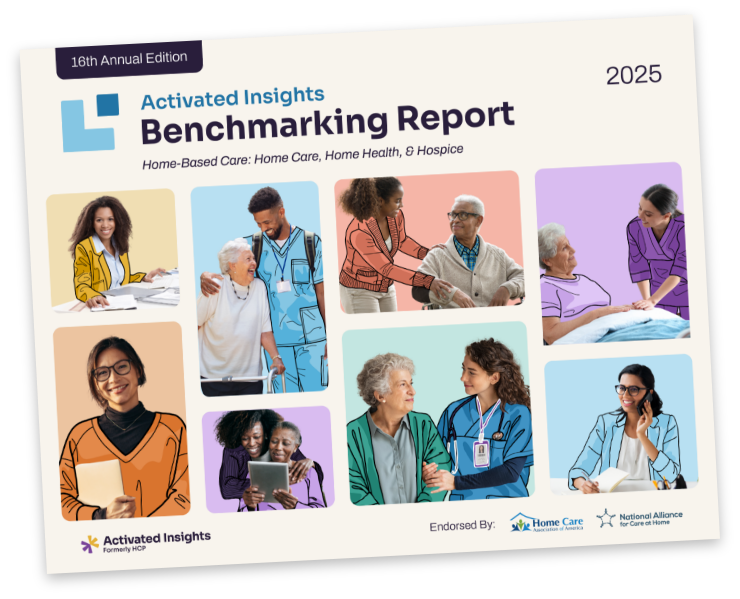
Home-based care agencies are taking a data-driven approach towards their sales & marketing campaign this year—are you behind? Explore the latest industry trends, tips, and strategies from the 2024 Activated Insights Benchmarking Report.
To mark the 15th Annual Edition of the 2024 Activated Insights (Formerly HCP) Benchmarking Report, we’re breaking down the key findings from each section to help get home-based care providers a head-start on turning benchmarking data into data-driven business decisions.
Strategize your sales and marketing efforts this year with these 3 tips.
Tip #1: Prioritize Customer Acquisition & Referrals
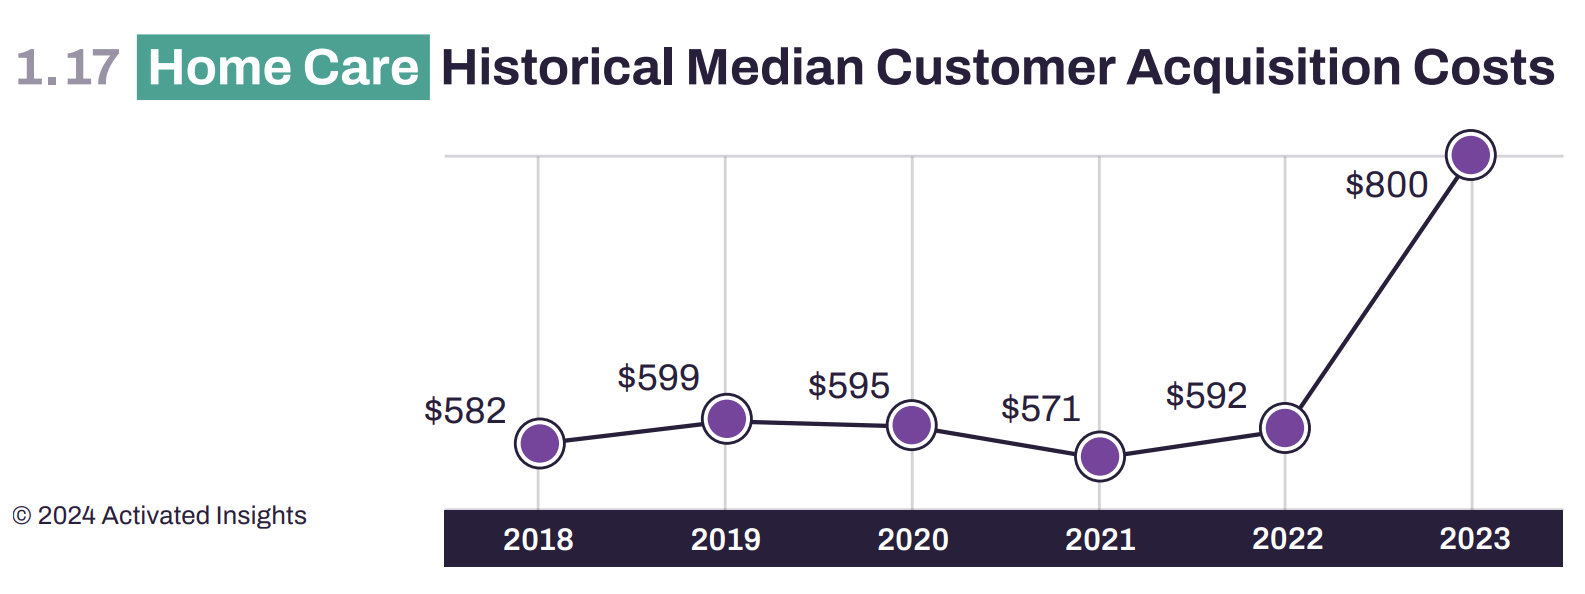
Finding: Rising customer acquisition costs highlight the urgency for you to prioritize strengthening your relationship with new referral sources.
Trend: Providers who prioritize building relationships and managing their reputation within the industry see unprecedented customer growth.
Threat/Opportunity: Customer acquisition costs are the highest they’ve been in five years.
Data-Driven Strategy: Create and strengthen your relationship with new referral sources by:
Tip #2: Track & Respond to Inquiries & Assessments
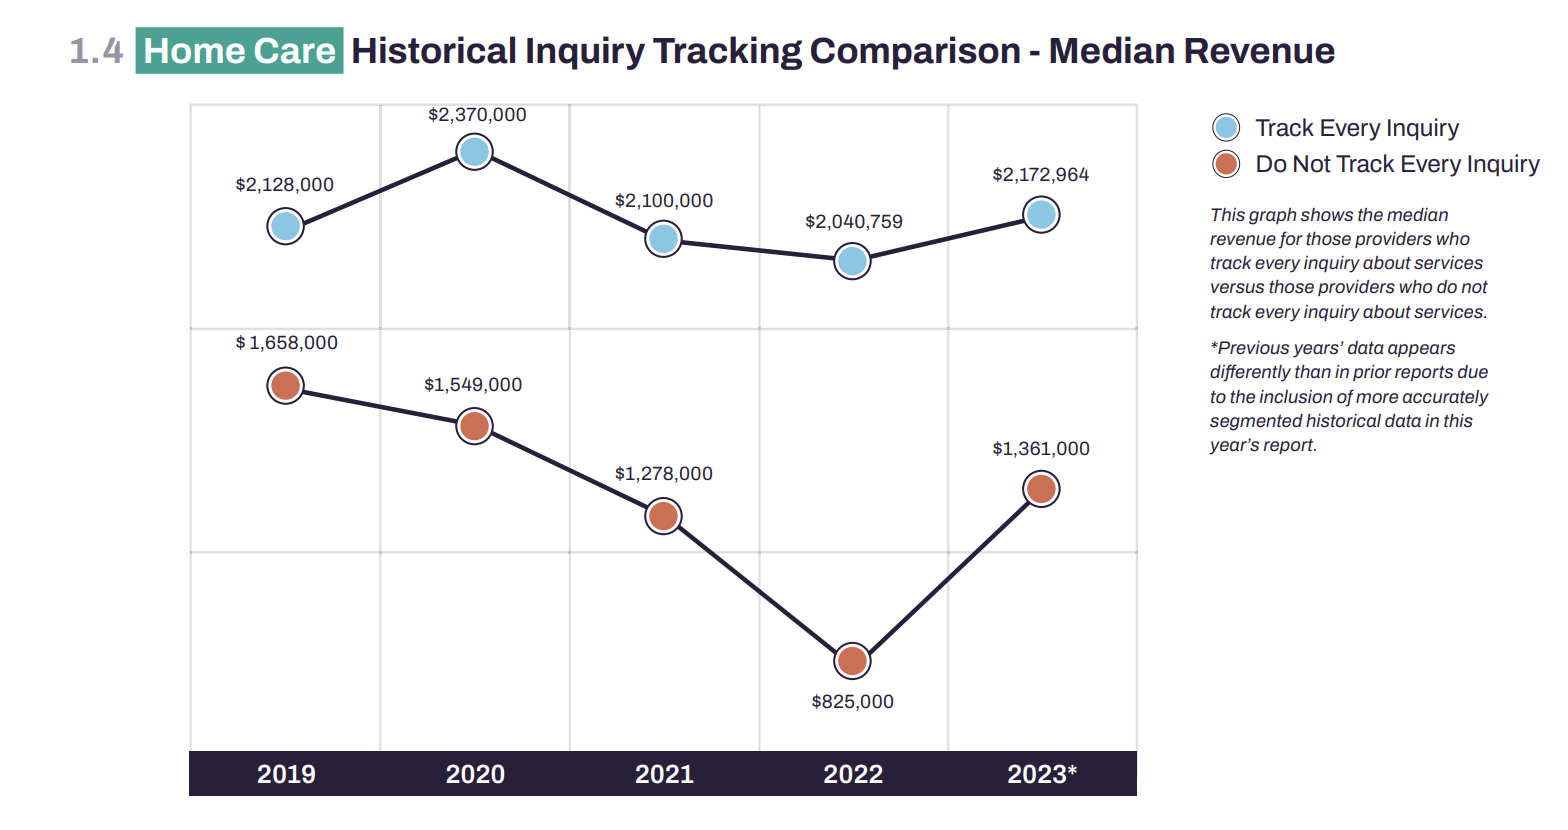
Finding: In the long-term & post-acute care industry, every interaction with someone directly correlates with your business’ reach and revenue.
Trend: Providers who track EVERY inquiry about their services see more ROI than those who only track some.
Threat/Opportunity: Only 1 in 4 providers can prove their quality-of-care outcomes with data.
Data-Driven Strategy: Prioritize booking an assessment after every single inquiry. Use a data-focused approach to calculate the ROI of your referral relationships and marketing campaigns by tracking and measuring:
Tip #3: Effectively Market Openings & Accolades to Improve Staffing
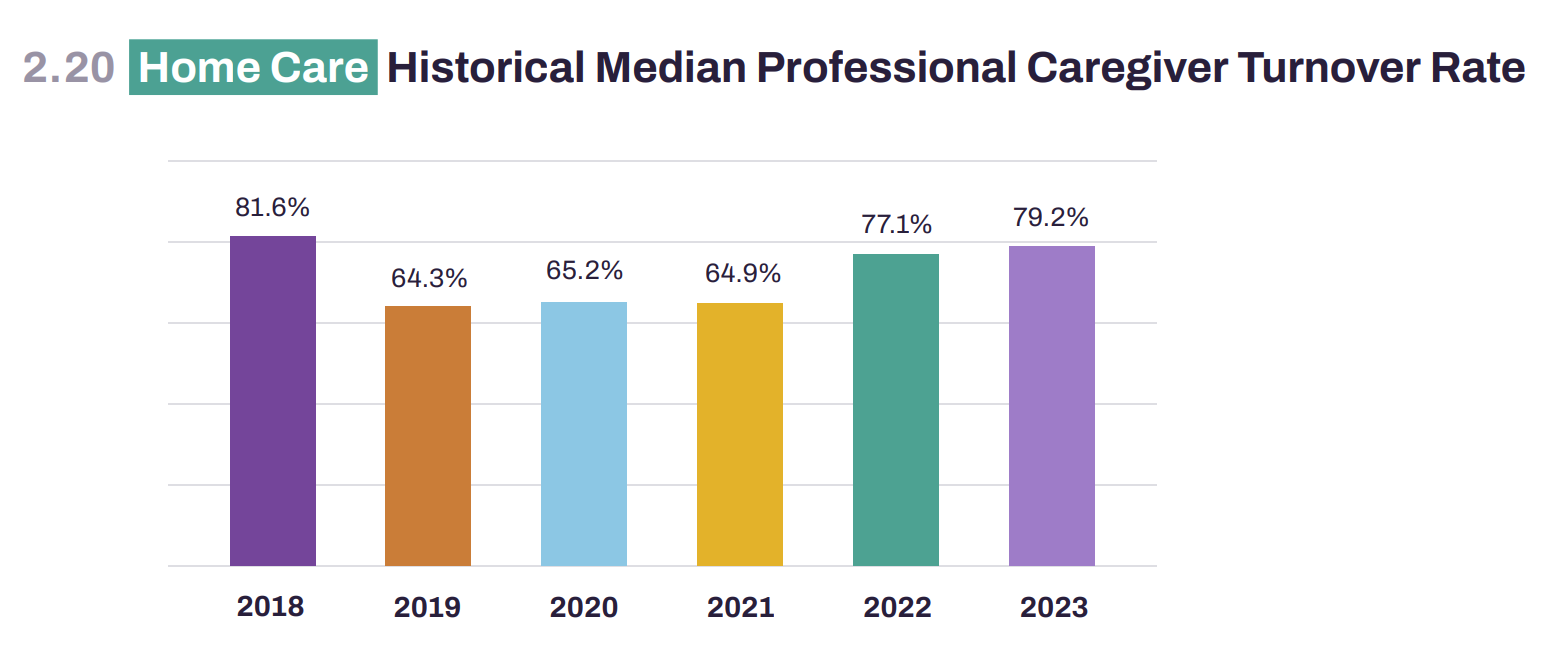
Finding: Although employee turnover rises to the highest in four years, homecare, home health, and hospice providers are most threatened by not being able to effectively market their services and employment opportunities.
Trend: Median care staff turnover spiked by 14% in the last two years for home-based care and increased by 8.3% in home health and hospice.
Threat/Opportunity: Despite turnover being at an all-time high, home-based care providers are more concerned with recruiting staff, while home health and hospice are worried about attracting enough referrals.
Data-Driven Strategy: Gather feedback from your current customers and employees to learn what they wish you’d start or stop doing to retain them—the promote it! Five expert tips to get you started:
For more data-driven strategies like these, access the full 2024 Activated Insights Benchmarking Report (formerly the HCP Benchmarking Report).
Make More Data-Driven Business Decisions:
Related Posts


