2022 Activated Insights Benchmarking
Report SnapShot

The SnapShot will give you a preview of the rich insights found in the 2022 Report. Use code NAHCSNAPSHOT22 for 25% off.

NAHC-Logo

Endorsed by NAHC

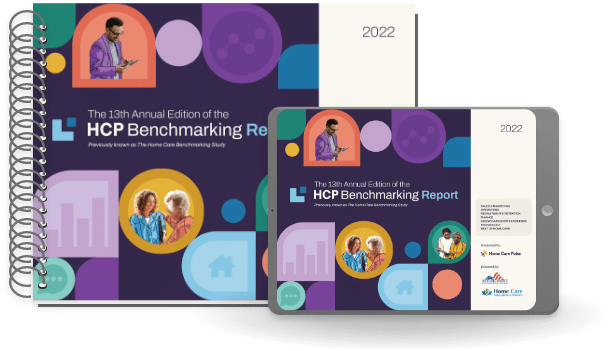
An open spiral-bound book and a tablet displaying the cover of "The 13th Annual Edition of the HCP Benchmarking Report 2022." The design features illustrations of people, geometric shapes, and icons related to care services.
Get 15% off the Report! (use code: NAHCSNAPSHOT22)
SECTION

Executive
Summary

The Executive Summary is an introduction to the 2022 Activated Insights Benchmarking Report. Included is a high-level overview of the Report and an update on the state of the industry from Todd Austin, President of Activated Insights. Vicki Hoak, Executive Director of the Home Care Association of America and Bill Dombi, President of the National Association for Home Care & Hospice also provide their insights in this section. The Executive Summary also includes an overview of the participants whose data is included in this Report, including years in business, provider type, geographic location, and annual revenue.
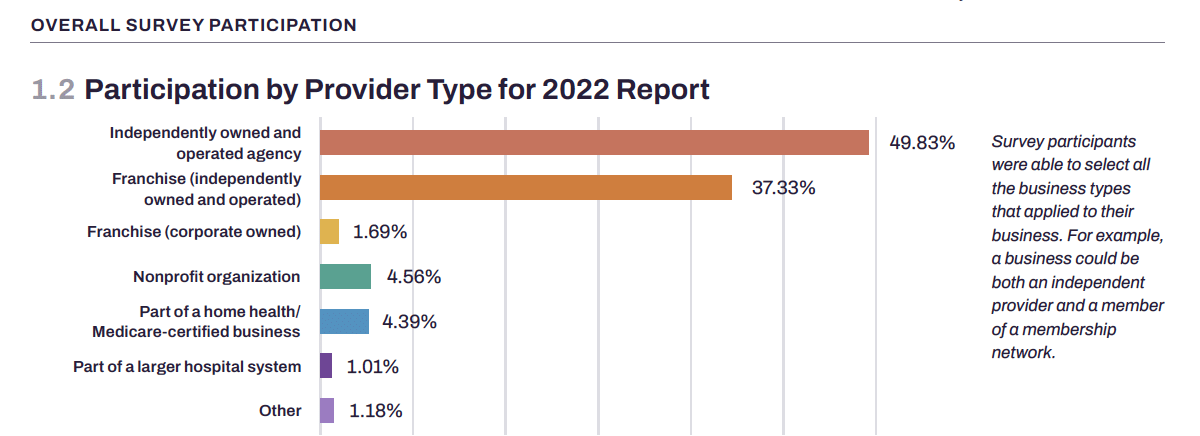
A bar chart titled "Participation by Provider Type for 2022 Report." Independently owned and operated agency: 49.83%, Franchise (independently owned and operated): 37.33%, Franchise (corporate owned): 1.69%, Nonprofit organization: 4.56%, Part of a home health/Medicare-certified business: 4.39%, Part of a larger hospital system: 1.01%, Other: 1.18%. Text notes survey participants could select all applicable business types.
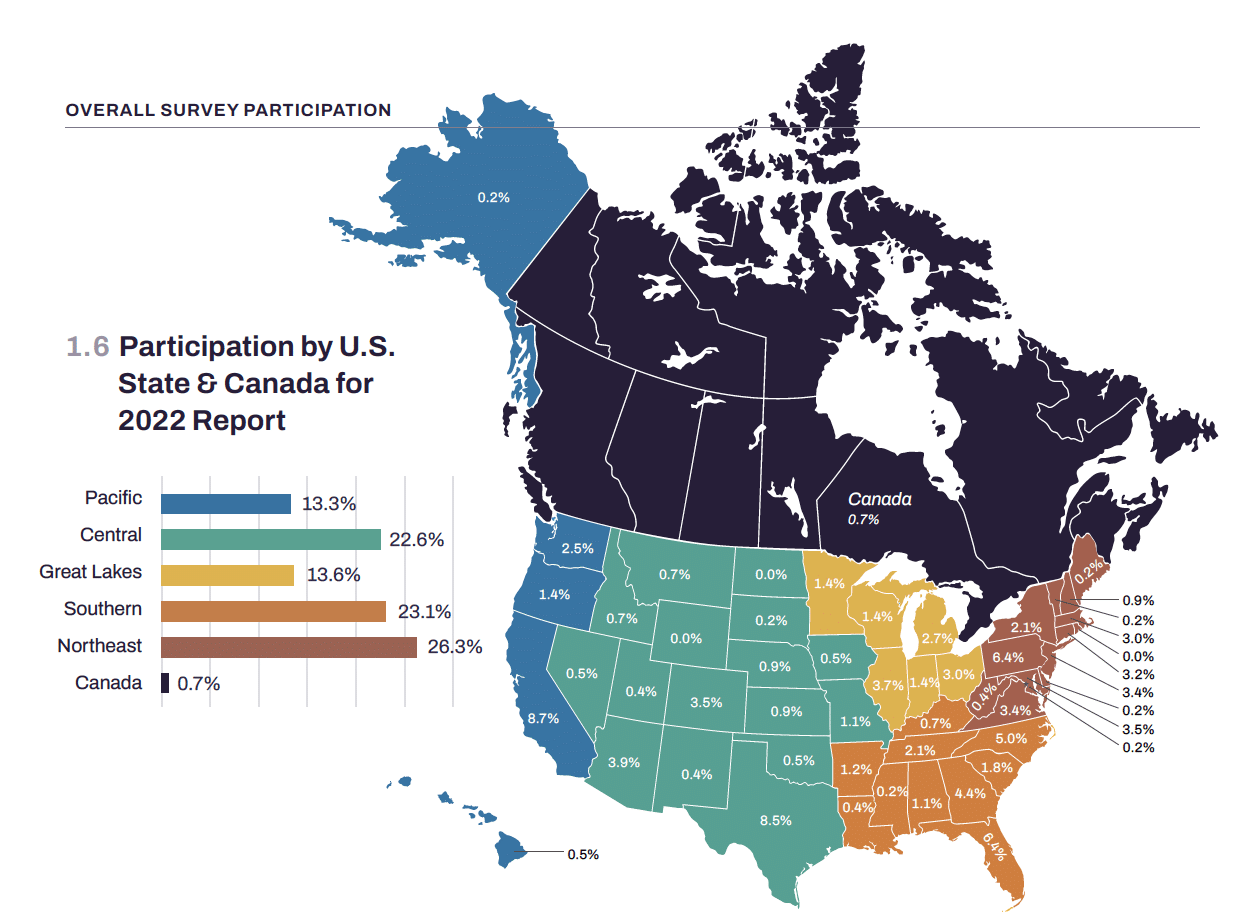
A map of North America shows survey participation rates by region for 2022. The highest participation rate is in the Northeastern U.S. at 26.3%, while Canada has a rate of 0.7%. Other regions' participation rates range from 0.2% to 23.1%.

What else is in the Executive Summary?

  • Historical Total Participation
  • Participation by Provider Type for 2022 Report
  • Historical Participation by Number of Locations
  • Historical Participation by Populations Served
  • Historical Participation by Years in Business
  • Participation by U.S. State & Canada for 2022 Report
  • Participation by Revenue Range for 2022 Report
  • Membership Associations for 2022 Report
  • Masters Participation by Provider Type for 2022 Report
  • Historical Masters Participation by Number of Locations
  • Historical Masters Participation by Population Served
  • Historical Masters Participation by Years in Business
  • Historical Masters Participation by Geographic Region
SECTION
Sales & Marketing

Home care agencies use a variety of strategies and channels to find new clients; this section dissects the results of each strategy to help you determine the best approach for your agency. The Sales & Marketing section dives deep into data regarding client acquisition and retention, including the top channels for consumer and referral marketing. It also includes the data on conversion rates and acquisition costs that you need to determine whether your sales and marketing programs measure up.
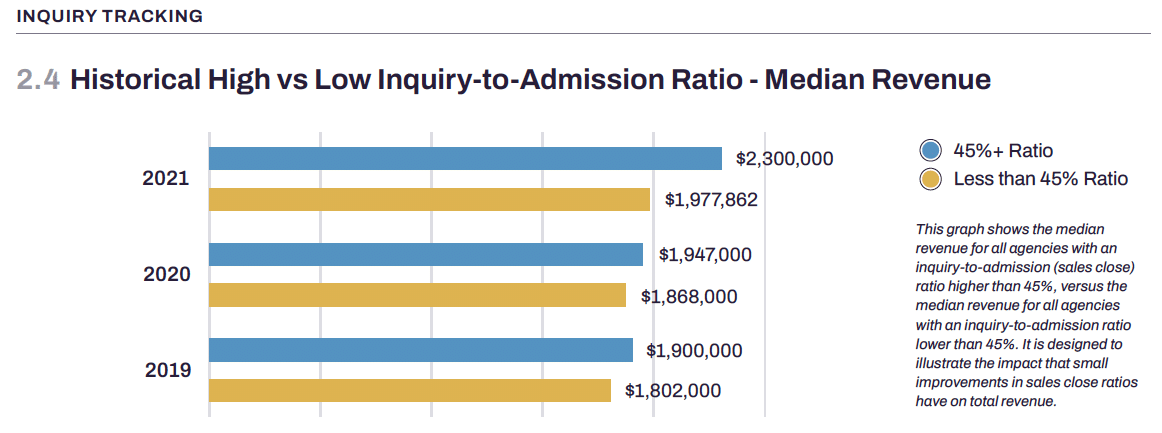
A bar chart titled "Historical High vs Low Inquiry-to-Admission Ratio - Median Revenue" compares the median revenue for high and low inquiry-to-admission ratio agencies from 2019 to 2021. High ratio bars are blue and low ratio bars are yellow.
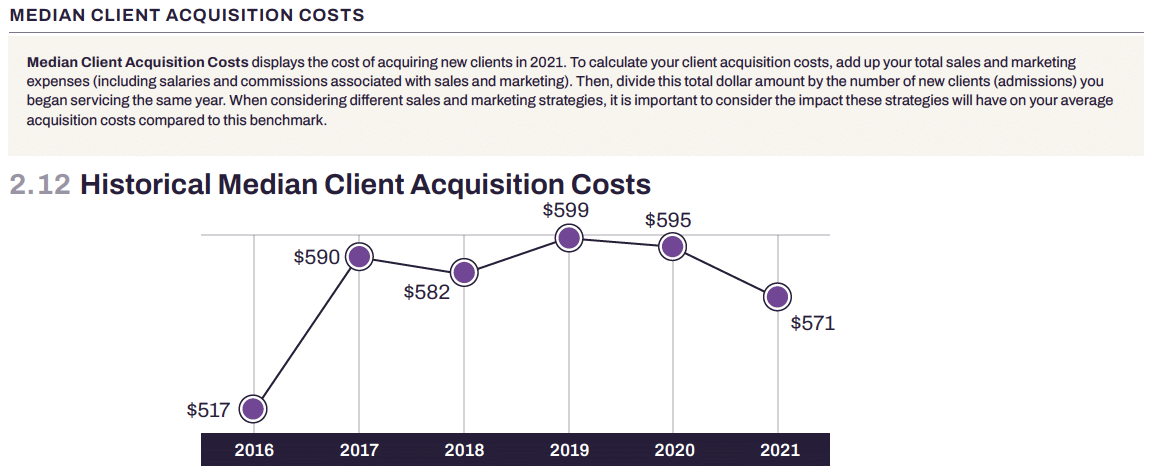
A graph titled "2.12 Historical Median Client Acquisition Costs" is shown. It plots median costs from 2016 to 2021, with data points at $590 for 2016, $581 for 2017, $599 for 2018, $593 for 2019, $595 for 2020, and $571 for 2021. A decreasing trend is observed.

What else is in Sales & Marketing?

  • 2021 Top 20 Marketing Sources – Overall
  • 2021 Top 10 Marketing Sources – Percent of Participants’ Top Source – Masters
  • Historical Inquiry Tracking Comparison – Median Revenue
  • Historical High vs Low Inquiry-to-Admission Ratio– Median Revenue
  • Median Sales Conversions for 2021 – Percentile Ranking
  • Median Sales Conversions for 2021 – Revenue Ranges
  • Annual Number of Inquiries – Agencies Using Activated Insights’s Platform
  • Top 5 Growth Opportunities for 2022
  • Historical Median Client Growth Rates
  • Median Client Growth Rates – Revenue Ranges
  • Median Client Growth Rates – Geographic Region
  • Historical Median Client Acquisition Costs
  • Historical Median Client Acquisition Costs – Geographic Region
  • Client Acquisition Costs for 2021 – Percentile Ranking
SECTION
Recruitment & Retention

As agencies continue to combat a historic care professional shortage, recruitment and retention are top of mind across the industry. The data in this section will provide the resources you need to take a data-driven approach to your own staffing. It is designed to help you understand the most common recruitment and retention practices, how effective those practices are, and which challenges are most relevant to your geographic region. It will also allow you to analyze what constitutes a competitive compensation, benefits, and training package for your region, enabling you to create your own unique strategy for improving the care professional experience.
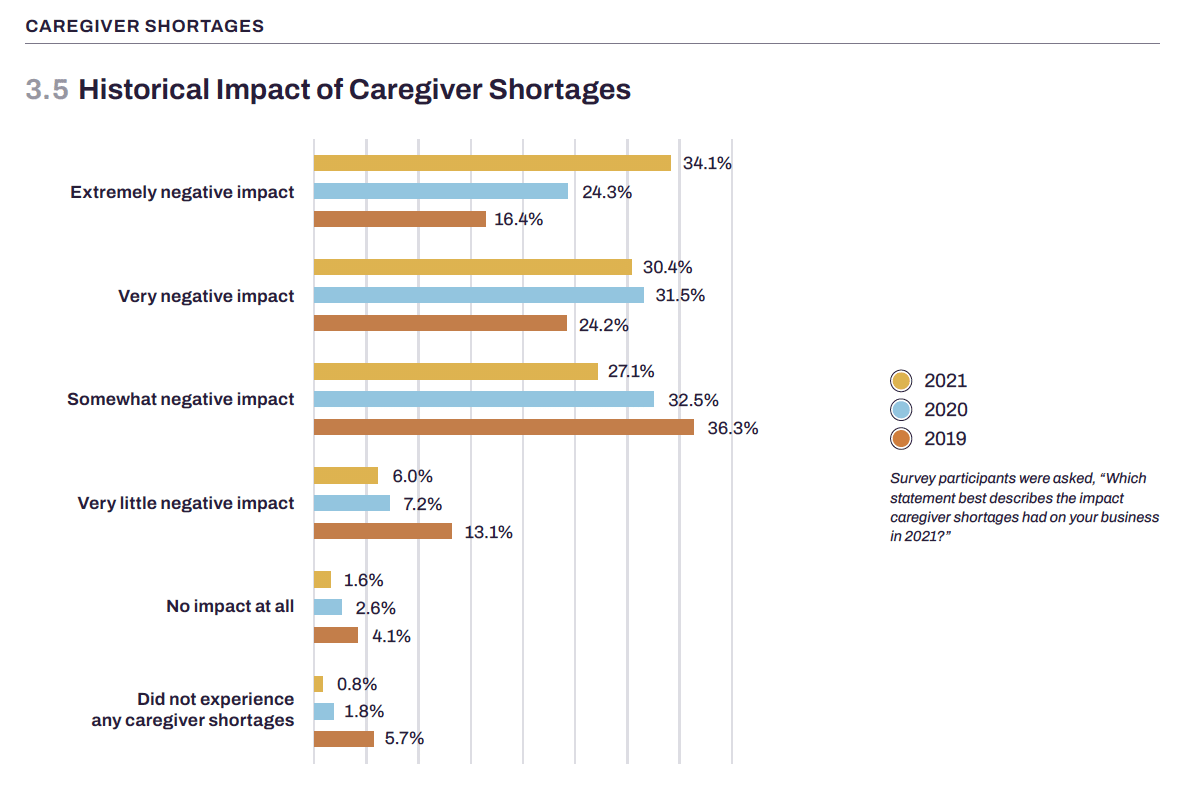
A bar chart titled "Historical Impact of Caregiver Shortages" compares survey responses from 2019, 2020, and 2021. Categories include extremely negative, very negative, somewhat negative, very little negative, little to no, and no impact. Each year is color-coded.
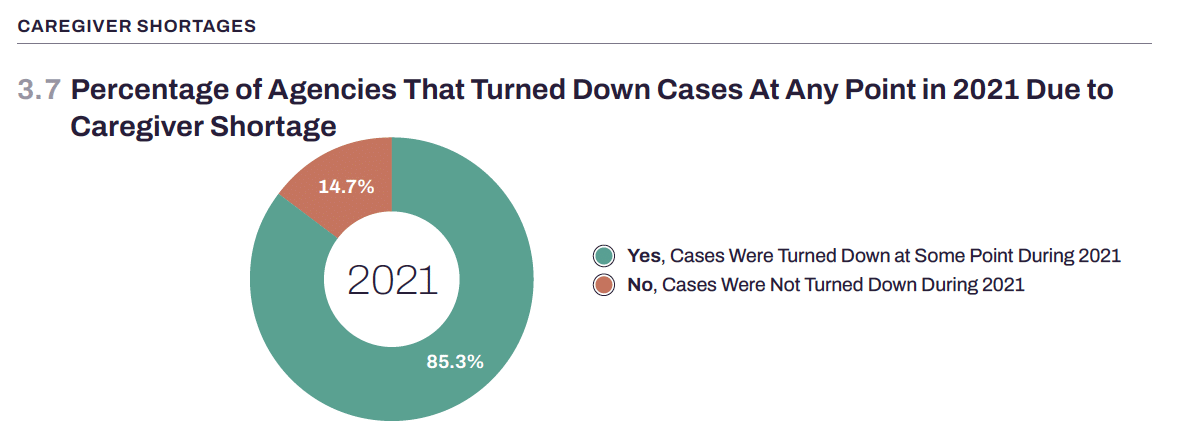
A doughnut chart titled "Percentage of Agencies That Turned Down Cases At Any Point in 2021 Due to Caregiver Shortage." It shows that 85.3% of agencies turned down cases, while 14.7% did not turn down cases in 2021.
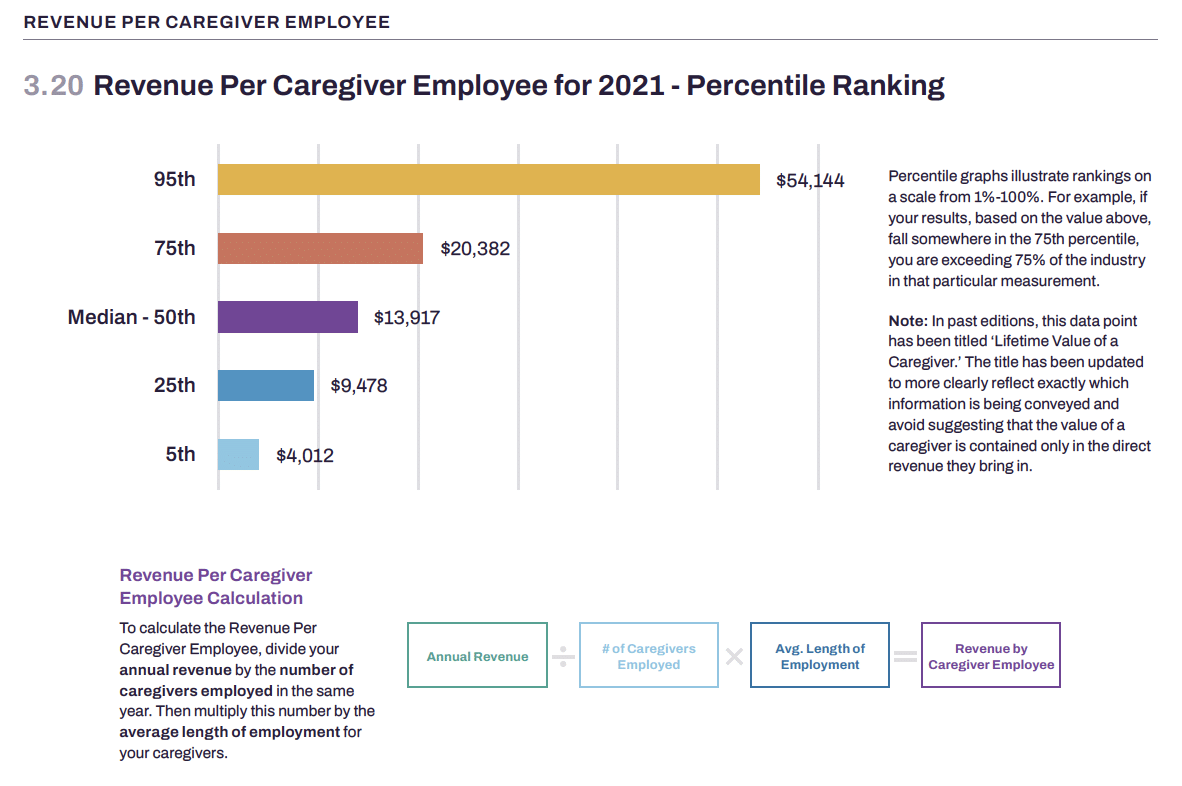
A bar graph titled "Revenue Per Caregiver Employee for 2021 - Percentile Ranking" shows data at the 95th ($54,144), 75th ($20,382), 50th ($13,917), and 25th ($9,348) percentiles. An info box at the top right and a formula for calculation are included at the bottom.

What else is in Recruitment & Retention?

  • Top 10 Care Professional Recruitment Sources/Methods for 2021
  • Top 10 Care Professional Recruitment Sources/Methods for 2021 – Masters
  • Top Care Professional Recruitment Sources for 2021 – Median Care Professional Turnover
  • Top Care Professional Recruitment Sources for 2021 – Median Care Professional Acquisition Cost
  • Historical Impact of Care Professional Shortages
  • Impact of Care Professional Shortages for 2021 – Geographic Regions
  • Percentage of Agencies That Turned Down Cases At Any Point in 2021 Due to Care Professional Shortage
  • Percentage of Agencies That Consistently Turned Down Clients Due to Care Professional Shortages in 2021
  • Median Care Professional Hiring Conversions for 2021 – Percentile Ranking
  • Median Hiring Conversions for 2021 – Masters ($5M+)
  • Median Hiring Conversions for 2021 – Revenue Range ($2.8M – $4.99M)
  • Median Hiring Conversions for 2021 – Revenue Range ($1.6M – $2.799M)
  • Median Hiring Conversions for 2021 – Revenue Range ($800K – $1.599M)
  • Median Hiring Conversions for 2021 – Revenue Range ($0 – $799K)
  • Historical Median Care Professional Turnover Rate
  • Historical Care Professional Turnover Rate – Percentile Ranking
  • Caregiver Turnover Rate by Percentile Ranking for 2021 – Geographic Region
  • Caregiver Turnover Rate for 2021 – Revenue Range
  • Historical Median Care Professional Turnover Rate – Geographic Region
  • Revenue Per Care Professional Employee for 2021 – Percentile Ranking
  • Historical Revenue Per Care Professional Employee – Percentile Ranking
  • Median Revenue Per Care Professional Employee for 2021 – Geographic Region
  • Median Revenue Per Care Professional Employee for 2021 – Revenue Ranges
  • Historical Median Care Professional Turnover – Care Professional Wages Comparison
  • Historical Median Hourly Care Professional Pay Ranges – Overall
  • Historical Live-In Care Professional Pay Ranges per 24-Hour Shift – Overall
  • Live-In Care Professional Pay Ranges per 24 Hour Shift for 2021 – Geographic Regions
  • Caregiver Wages by Geographical Region for 2021 – Pacific
  • Caregiver Wages by Geographical Region for 2021 – Central
  • Caregiver Wages by Geographical Region for 2021 – Great Lakes
  • Caregiver Wages by Geographical Region for 2021 – Southern
  • Caregiver Wages by Geographical Region for 2021 – Northeast
  • Historical Percentage of Agencies providing Care Professional Benefits
  • Caregiver Benefits Provided for 2021 – Overall & Revenue Ranges
  • Median Care Professional Acquisition Cost for 2021 – Number of Care Professionals Employed
  • Median Care Professional Turnover Rate – Number of Care Professionals Employed
  • Caregiver Benefits Provided for 2021 – Number of Care Professionals Employed
  • Number of Training Hours for 2021 – Percentile Ranking
  • Number of Orientation Training Hours for 2021 – Revenue Range
  • Number of Orientation Training Hours for 2021 – Geographic Regions
  • Median Number of Ongoing Training Hours for 2021 – Revenue Range
  • Median Number of Ongoing Training Hours for 2021 – Geographic Regions
  • Historical Top 10 Professional Training Programs
  • Median Care Professional Turnover Rate – Training Type Used in 2021
  • Median Revenue Per Care Professional Employee – Training Type Used in 2021
  • Median Care Professional Acquisition Cost – Training Type Used in 2021
  • Median Revenue Per Care Professional Employee by Orientation Training Hours for 2021
  • Median Revenue Per Care Professional Employee by Ongoing Training Hours for 2021
  • Training Type Used in 2021 – Revenue Range
  • Training Type Used in 2021 – Geographic Regions
  • Percent of Agencies That Provide Training By Topic
  • Percentage of Agencies That Provided Specialty Care Training in 2021
  • Percentage of Agencies That Provide Specialty Care Training By Topic
SECTION
Finance

The Finance section gives you a look at the average balance sheet of other agencies in your region, revenue range, or the industry as a whole. It contains information on revenue, expenses, payer sources, and profit and loss comparisons. The insights in this section will allow you to compare your expenses to other home care providers and identify where you may be overspending. It also covers median billing rates by region to help you keep your pricing competitive.
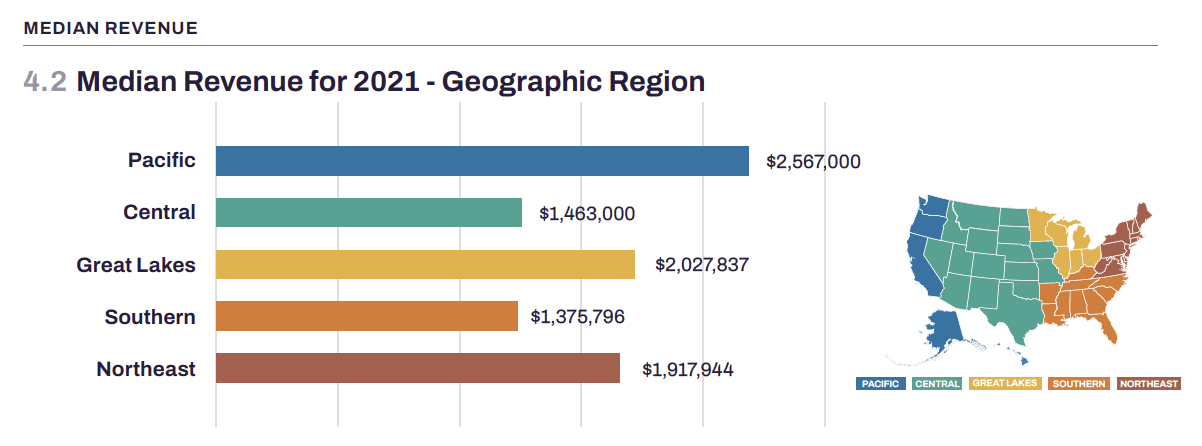
Bar chart titled "4.2 Median Revenue for 2021 - Geographic Region" with revenues for Pacific ($2,657,000), Central ($1,463,000), Great Lakes ($2,027,837), Southern ($1,375,796), and Northeast ($1,917,944). A color-coded US map highlights these regions.
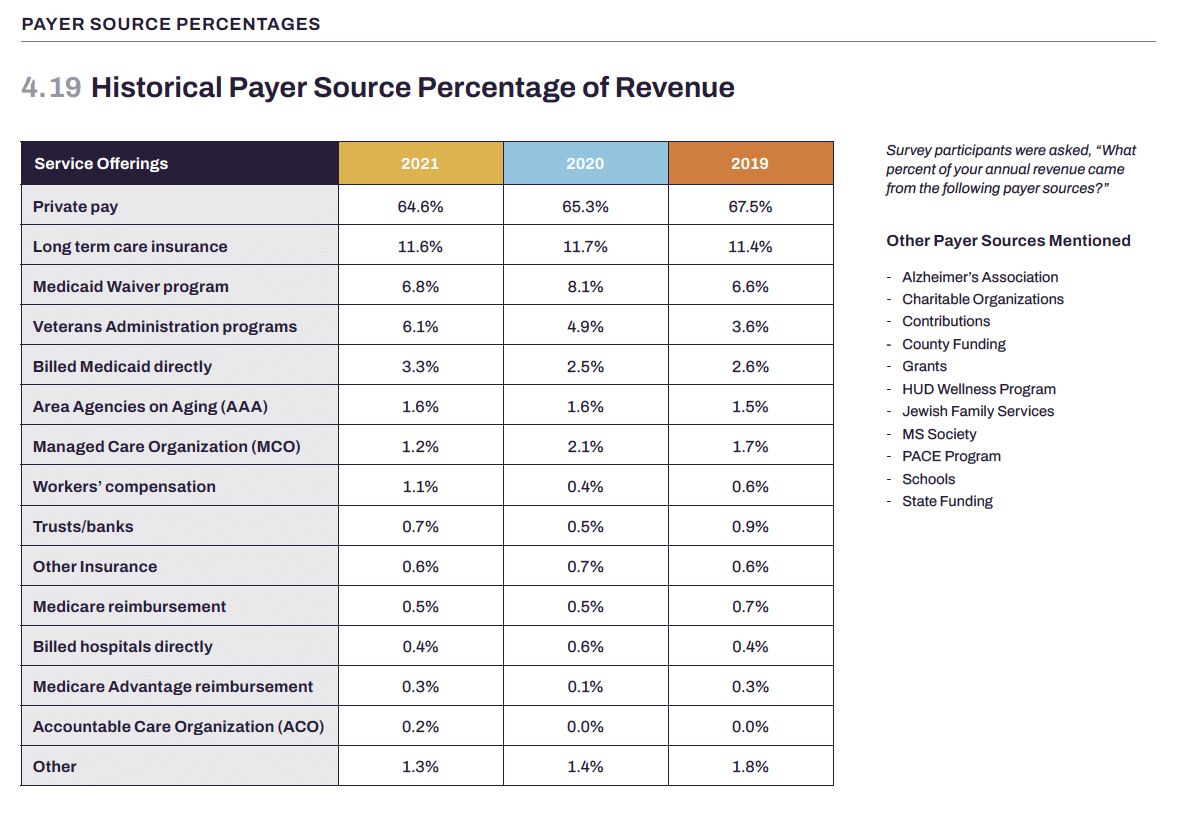
A chart titled "4.19 Historical Payer Source Percentage of Revenue" shows payer sources from 2019 to 2021. Categories such as Private pay, Long term care insurance, and several others are listed with associated percentages. A list of other payer sources is also mentioned.
A pie chart titled "Service Billing Methods for 2021" depicts how home care providers bill for hourly in-home care services. The segments show: Length of Visit & Caregiver Skill Needed (58.2%), Length of Visit (33.0%), Caregiver Skill Needed (6.0%), and Other (2.8%).

What else is in Finance?

  • Historical Median Revenue
  • Median Revenue for 2021 – Geographic Region
  • Median Revenue for 2021 – Number of Locations
  • Median Revenue for 2021 – Population Served
  • Historical Median Revenue – HCAOA Members vs. Non-Members
  • Historical Median Revenue – NAHC Members vs. Non-Members
  • Historical Median Revenue – Activated Insights Users vs. Non-Users
  • Historical Revenue Percentile Rankings
  • Historical Revenue Percentile Rankings – Masters
  • Revenue Percentile Rankings for 2021 – Years in Business
  • Revenue Percentile Rankings for 2021 – Population Served
  • Revenue Percentile Rankings for 2021 – Geographic Region
  • Profit & Loss Comparison for 2021 – Geographic Region
  • Profit & Loss Comparison for 2021 – Number of Locations
  • Profit & Loss Comparison for 2021 – Revenue Ranges
  • Sales & Marketing Expenses Percentile Ranking for 2021 – Revenue Ranges
  • Recruitment & Retention Expenses Percentile Ranking for 2021 – Revenue Ranges
  • Historical Revenue Generated by Service Offerings
  • Historical Payer Source Percentage of Revenue
  • Historical Median Weekly Billable Hours
  • Service Billing Methods for 2021
  • Historical Median Billing Rates by Length of Visit
  • Median Billing Rates by Length of Visit for 2021 – Percentile Ranking
  • Median Billing Rates by Length of Visit for 2021 – Geographic Region
  • Median Billing Rates by Care Professional Skill Level for 2021 – Percentile Ranking
  • Caregiver Skill Level Billing Rates for 2021 – Geographic Region
  • Historical Percent of Providers Offering Live-In Care
  • Historical Median Live-In Care Billing Rates
  • Median Live-In Care Billing Rates for 2021 – Geographic Region
SECTION
Operations

The Operations section helps you identify and prepare for the largest threats facing your agency in the coming year. It provides the insight you need to evaluate the internal management of your home care agency, with data on client turnover rates, staffing numbers, salaries and benefits, and readmission rates.

A pie chart titled "Percentage of Providers Tracking Hospital Readmission Rates for 2021." It shows that 78.2% of providers are tracking readmission rates (in red), while 21.8% are not tracking readmission rates (in green). The center of the chart displays "2021.
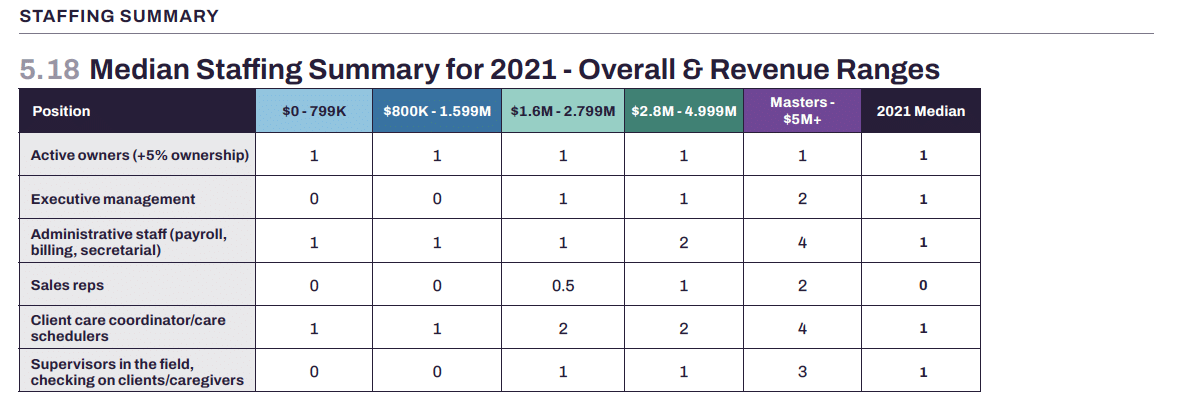
A table titled "5.18 Median Staffing Summary for 2021 - Overall & Revenue Ranges" shows the number of employees in various positions across different revenue ranges. Positions include Active owners, Administrative staff, Sales reps, Client care coordinators, and Supervisors.
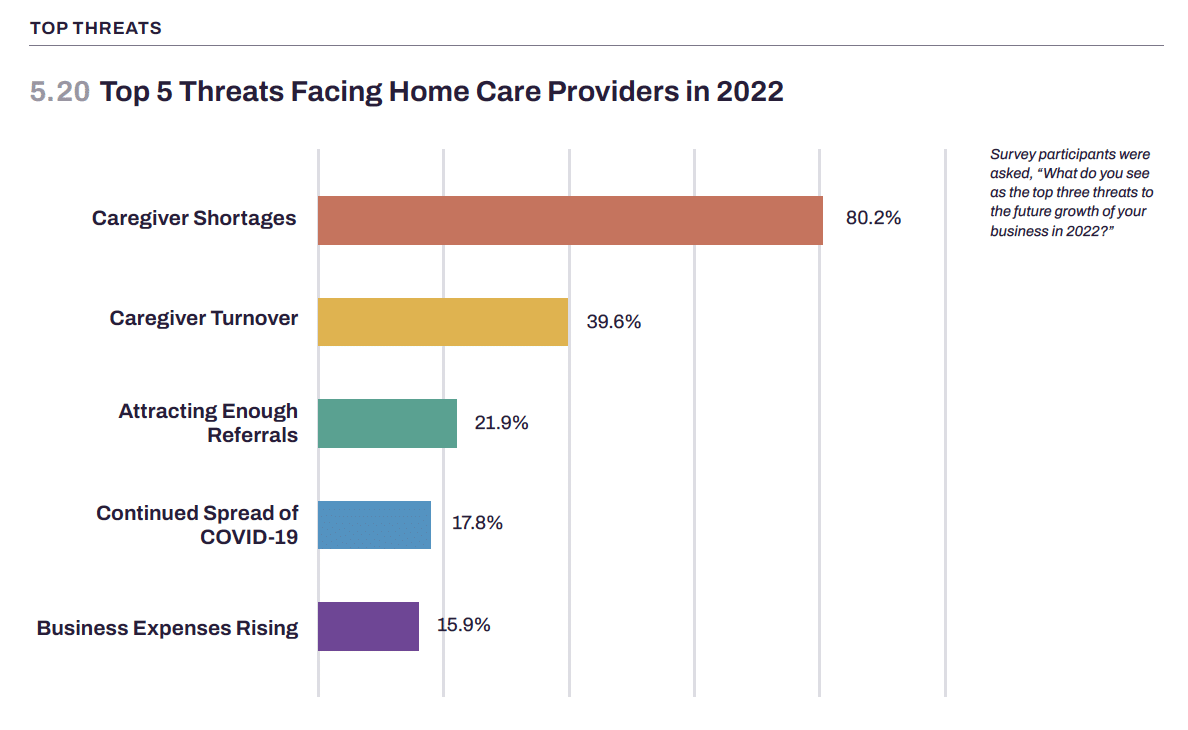
Bar chart showing the top 5 threats facing home care providers in 2022. They are: Caregiver Shortages (80.2%), Caregiver Turnover (39.6%), Attracting Enough Referrals (21.9%), Continued Spread of COVID-19 (17.8%), and Business Expenses Rising (15.9%).

What else is in Operations?

  • Historical Service Offerings – Overall
  • Service Offerings for 2021 – Revenue Ranges
  • Service Offerings for 2021 – Geographic Regions
  • Historical Client Turnover Rate
  • Client Turnover Rate for 2021 – Percentile Ranking
  • Client Turnover Rate for 2021 – Revenue Ranges
  • Client Turnover Rate for 2021 – Geographic Region
  • Historical Client Average Length of Service (By Month) – Percentile Ranking
  • Historical Client Average Lifetime Value – Percentile Ranking
  • Percentage of Providers Tracking Hospital Readmission Rates for 2021
  • Hospital Readmission Rate for 2021 – Percentile Ranking
  • Historical Sales per Full-Time Employee – Revenue Ranges
  • Historical Sales per Full-Time Employee – Geographic Region
  • Weekly Billable Hours per Care Coordinator for 2021
  • Weekly Billable Hours per Non-Caregiver Employee for 2021
  • Number of Office Staff Employed for 2021 – Overall & Revenue Ranges
  • Median Office Staff Annual Salaries for 2021 – Overall & Revenue Ranges
  • Median Staffing Summary for 2021 – Overall & Revenue Ranges
  • Median Staffing Summary for 2021 – Geographic Regions
  • Top 5 Threats Facing Home Care Providers in 2022
  • Office Staff Turnover for 2021 – Overall & Revenue Ranges
  • Historical Median Office Staff Turnover – Geographic Regions
  • Provided Office Staff Benefits in 2021
  • Office Staff Benefits Provided in 2021 – Overall & Revenue Ranges
SECTION
Technology

The Technology section is an overview of the software platforms agency owners are using to manage their business and improve their operations, including scheduling software, customer relationship management software (CRM), and applicant tracking systems (ATS). It is intended to provide you with perspective on what tools are helping other home care providers achieve success and how you could leverage them in your own agency.
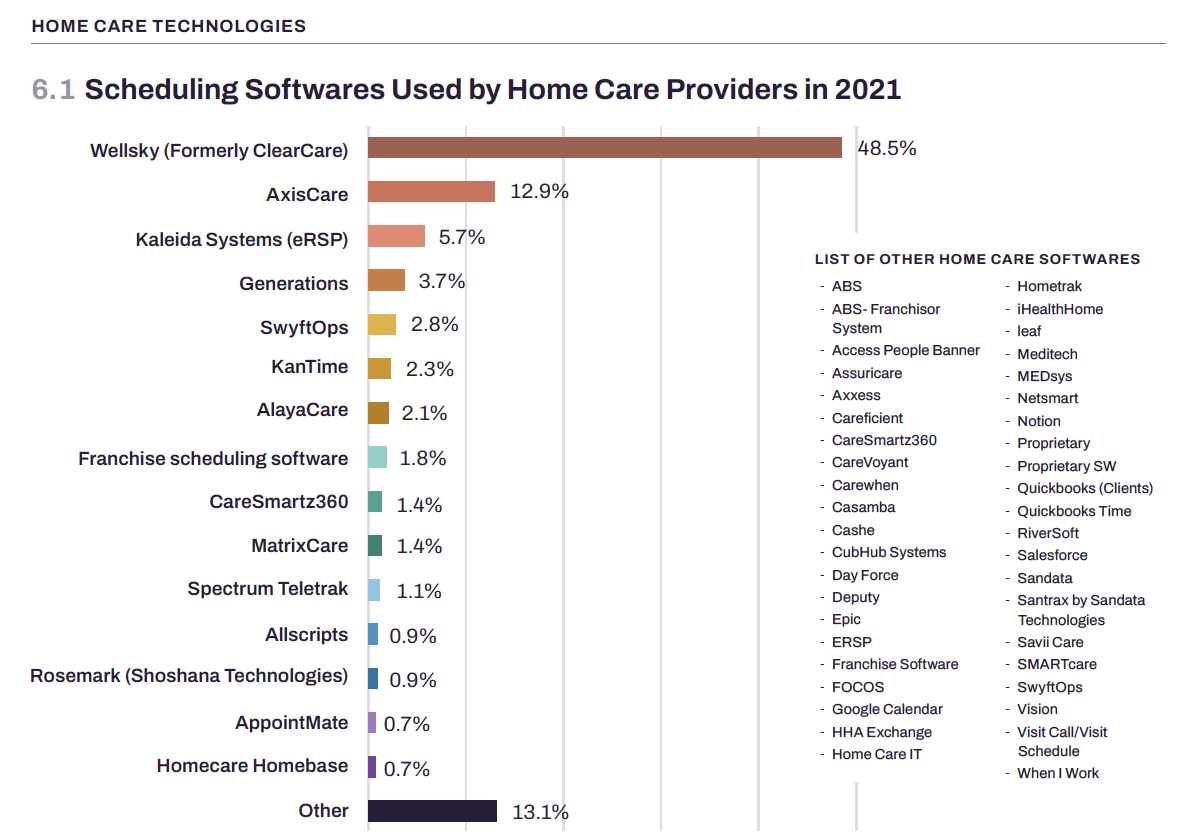
Bar chart titled "Scheduling Softwares Used by Home Care Providers in 2021" shows "Wellsky (Formerly ClearCare)" leading with 48.5%, followed by "AxisCare" at 12.9%, and "Kalidea Systems (eRSP)" at 5.7%. A list of other home care software names is also shown.

What else is in Technology?

  • Scheduling Softwares Used by Home Care Providers in 2021
  • Providers Who Use A Software Program for Online Review Management
  • Review Management Programs Used by Home Care Providers in 2021

To see all data and insights purchase the 2022 Activated Insights Benchmarking Report

Use code NAHCSNAPSHOT22 for 25% off.

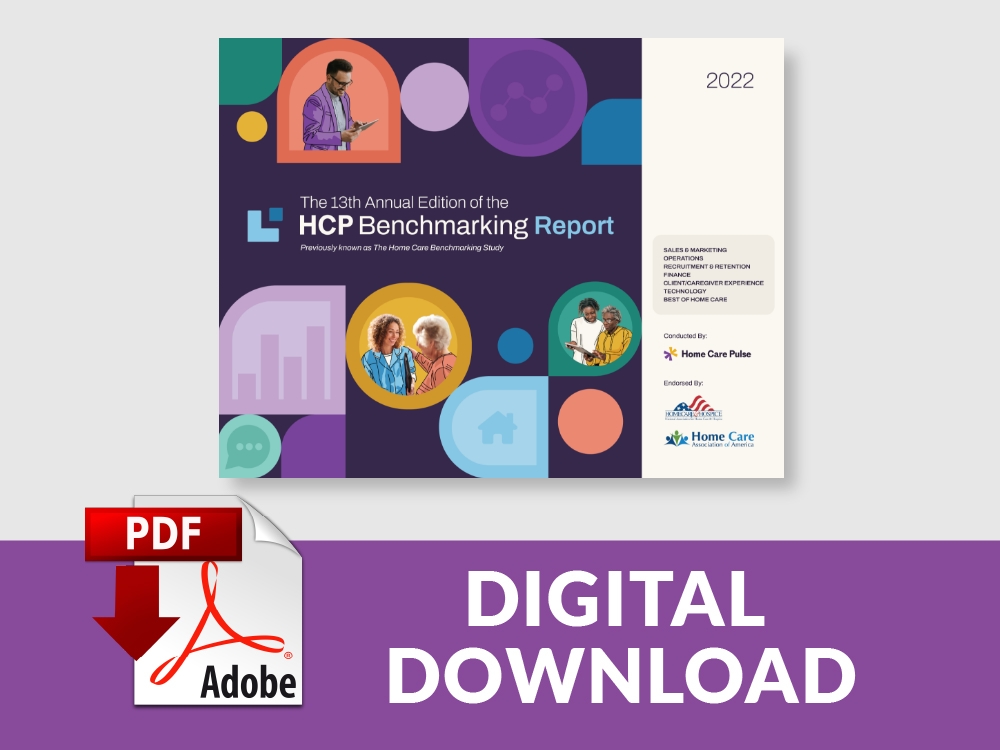
Cover of the "13th Annual Edition of the HCP Benchmarking Report" for 2022, featuring a collage of healthcare professionals and seniors, with logos of industry sponsors. Below, an Adobe PDF icon indicates that the report is available for digital download.

DIGITAL EDITION

$399

A coiled, spiral-bound book titled "The 12th Annual Edition of the HCP Benchmarking Report" with colorful graphics of diverse people on the cover lies on a white surface. A PDF icon with the Adobe logo and the text "INCLUDES DIGITAL EDITION" is placed nearby.

HARD COPY

$449